Finnifty Option Chain: A Comprehensive Guide

Introduction
The Finnifty Option Chain is a crucial concept for anyone involved in trading financial markets, particularly those focusing on Indian stock markets. The option chain is a comprehensive tool that provides valuable insights into the derivatives market, helping traders make informed decisions. This tool offers detailed data on various strike prices, calls, puts, and their respective open interest, enabling traders to gauge market sentiment and potential price movements.
In this blog post, we’ll explore the Finnifty Option Chain, how it functions, and how traders use it to enhance their decision-making process. Whether you’re a novice or an experienced investor, understanding how to read and interpret the option chain can significantly improve your trading strategy. So, let’s dive in and uncover all you need to know about the Finnifty Option Chain.
What is the Finnifty Option Chain?
The Finnifty Option Chain represents a list of all options contracts available for a particular underlying asset, in this case, the Nifty financial index. It includes data on all available strike prices, the expiry date of the options, and key metrics such as the open interest, volume, implied volatility, and other important indicators. The Finnifty Option Chain provides traders with a full view of the options market, allowing them to identify trends and make predictions about future market movements.
Understanding the Finnifty Option Chain is essential for any trader looking to capitalize on the volatility of the options market. It can help traders understand market sentiment and gauge the level of bullish or bearish pressure surrounding a particular asset. By analyzing the data within the option chain, traders can make more strategic and informed trades, ultimately improving their chances of success in the market.
Components of the Finnifty Option Chain
The Finnifty Option Chain consists of several key components that traders use to analyze market trends. These include the following:
- Strike Price: The agreed-upon price at which an option holder can buy or sell the underlying asset.
- Calls and Puts: Calls represent options to buy, while puts represent options to sell the asset.
- Open Interest: The total number of outstanding contracts that have not been closed or exercised.
- Volume: The number of contracts traded during a particular time frame.
- Implied Volatility: A measure of the market’s expectations of future volatility.
Each of these components plays an important role in analyzing the Finnifty Option Chain and making informed trading decisions. By closely monitoring these elements, traders can anticipate price movements and adjust their strategies accordingly.
How to Read the Finnifty Option Chain
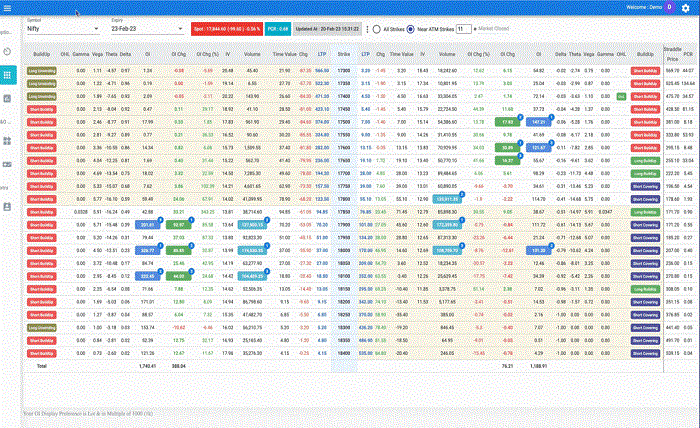
To read the Finnifty Option Chain effectively, traders need to understand how to interpret the various columns and data points. The option chain typically displays a table with columns for strike prices, calls, puts, open interest, volume, and other critical metrics.
The strike prices are listed in ascending order, and for each strike price, you’ll see two columns for calls and puts. Calls are listed on the left, and puts are listed on the right. Next to these columns, you’ll see the open interest and volume for both the calls and puts. Traders can use this data to determine which strike prices have the most interest from other traders, indicating potential levels of support or resistance.
Additionally, the Finnifty Option Chain will also display implied volatility, which provides insight into market sentiment and expectations for future price movements. By carefully analyzing this information, traders can better gauge market conditions and make more informed trades.
The Role of Open Interest in Finnifty Option Chain
Open interest is one of the most important metrics in the Finnifty Option Chain, as it shows the total number of contracts that are currently open and have not been exercised or closed. High open interest often indicates strong market interest in a particular option, which can be useful for determining levels of support and resistance.
For example, if a strike price has high open interest on the call side, it may indicate a significant level of resistance at that price. Conversely, high open interest on the put side could indicate strong support at that price. Analyzing open interest alongside other metrics, such as volume and implied volatility, can help traders predict future price movements and refine their trading strategies.
Open interest also plays a key role in understanding the liquidity of the option contracts. A higher open interest typically means that it’s easier to enter and exit trades without causing significant price fluctuations, which is an important factor for active traders.
Volume vs Open Interest in Finnifty Option Chain
Both volume and open interest are essential elements of the Finnifty Option Chain, but they serve different purposes. Volume represents the number of contracts that have been traded during a specific period, while open interest reflects the total number of contracts that remain open and have not been closed.
Volume can provide traders with insights into the activity level in a particular contract. High volume suggests that there is significant trading interest in a particular option, which could indicate potential price movement. On the other hand, open interest reflects the market’s long-term interest in an option. If an option has both high volume and high open interest, it can be a sign that the option is gaining popularity and could lead to significant price action.
Traders use both volume and open interest to assess the strength of a price trend. When volume and open interest are rising in tandem, it often suggests that the current trend is strong and likely to continue. However, if volume is rising but open interest is falling, it may indicate a weakening trend, and traders should be cautious.
Implied Volatility in the Finnifty Option Chain
Implied volatility (IV) is another critical component of the Finnifty Option Chain. It represents the market’s expectations of future price fluctuations in the underlying asset, as implied by the prices of options contracts. Higher implied volatility indicates that the market expects greater price movement, while lower implied volatility suggests a more stable market.
By analyzing implied volatility, traders can gain valuable insights into market sentiment. For example, if implied volatility is high, it may suggest that the market expects a significant event, such as an earnings announcement or a geopolitical event, to affect the price of the asset. On the other hand, low implied volatility often indicates that the market expects little movement in the near term.
Traders can use implied volatility to identify potential buying or selling opportunities. For example, if implied volatility is low, traders might consider selling options contracts, as they are likely to be priced lower. Conversely, if implied volatility is high, options contracts may be more expensive, and traders might consider buying options to take advantage of potential price swings.
Using the Finnifty Option Chain for Risk Management
The Finnifty Option Chain is not just a tool for making profitable trades; it is also an essential resource for managing risk. By analyzing the option chain data, traders can assess their exposure to potential price movements and make adjustments to their positions accordingly.
One of the most common risk management strategies is using options as a hedge. For example, if a trader holds a long position in the underlying asset, they may buy put options to protect themselves from potential downside risk. Conversely, traders can use call options to hedge against potential price increases.
By monitoring open interest, volume, and implied volatility in the Finnifty Option Chain, traders can gauge the likelihood of different market outcomes and adjust their positions to minimize risk. This proactive approach to risk management can help traders protect their portfolios during periods of high volatility.
Benefits of Trading with Finnifty Option Chain
Trading with the Finnifty Option Chain offers several key benefits for investors looking to navigate the options market. First and foremost, it allows traders to make more informed decisions by providing access to a wide range of data and insights. By understanding the trends and market sentiment reflected in the option chain, traders can improve their timing and accuracy when entering and exiting trades.
Additionally, the Finnifty Option Chain offers transparency in the options market, allowing traders to see where the market’s interest lies. By analyzing open interest, volume, and implied volatility, traders can better gauge the strength of trends and make more strategic decisions. This level of insight is crucial for anyone looking to gain an edge in the fast-paced world of options trading.
Conclusion
In conclusion, the Finnifty Option Chain is a powerful tool that can significantly enhance your trading strategy. By providing detailed insights into the options market, it allows traders to make informed decisions based on key metrics such as open interest, volume, and implied volatility. Understanding how to read and interpret the option chain can help traders identify trends, manage risk, and ultimately improve their profitability.
While the Finnifty Option Chain may seem complex at first glance, with practice and attention to detail, it becomes an invaluable resource for anyone serious about trading options. By incorporating the insights gained from the option chain into your trading strategy, you can enhance your ability to predict market movements and make more profitable trades.
FAQs
Q1. What is the Finnifty Option Chain?
A1. The Finnifty Option Chain is a data table that displays information on available options contracts for the Nifty financial index, including strike prices, open interest, volume, and implied volatility.
Q2. How can I use the Finnifty Option Chain in trading?
A2. Traders use the Finnifty Option Chain to analyze market trends, identify support and resistance levels, and make informed decisions based on open interest, volume, and implied volatility.
Q3. What is the difference between volume and open interest?
A3. Volume represents the number of contracts traded, while open interest represents the total number of contracts still open. Both metrics are essential for understanding market sentiment and potential price movements.


